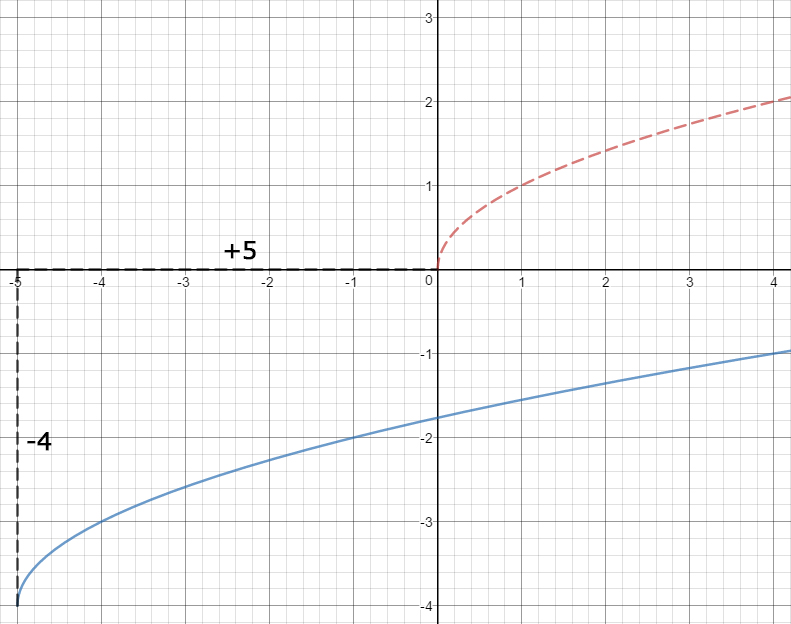
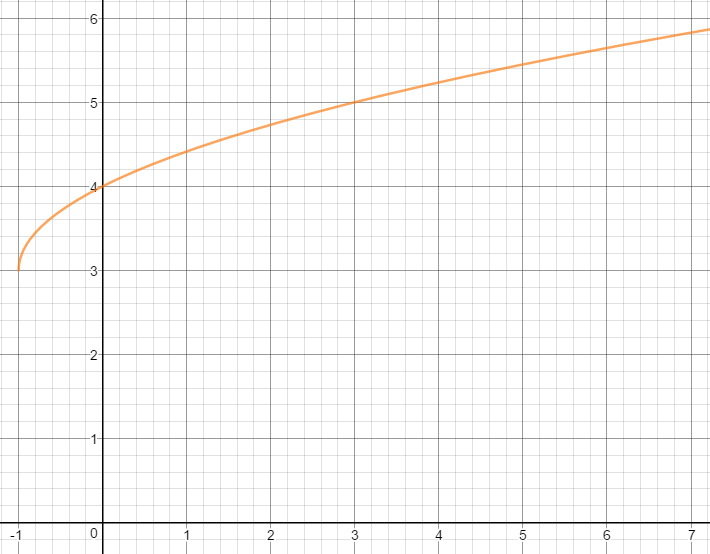
Here's a video by mathman1024 showing you how to quickly graph a square root function by looking at it's horizontal and vertical translations. The general form will be: f(x)=x±a±b
Here the a is the horizontal translation because it is inside the square root part. A positive number shifts the graph to the left and a negative number shifts the graph to the right.
The b is the vertical shift because it is outside the square root part. A positive number shifts the graph up and a negative number shifts the graph down.
The example he graphs is: f(x)=x+5−4. So first we notice the number inside the square is +5. Since this is the horizontal shift and it's positive we know the graph shifts to the left five units. Then the number outside the square is −4. This is the vertical shift and it's negative so we know the graph will shift down by four units.
In the previous couple of lessons, we learned about square root functions, cube root functions, and fourth root functions. We briefly learned about the function transformations associated with the radical functions, but in this lesson, we'll go more in-depth on translating radical graphs horizontally.
Translating Radical Graphs Horizontally
For this lesson, we're going to use the cube root function, 3x, as our parent function, but any other radical function would work!
We'll notice that the midpoint, or turning point, of this function is at the origin, (0,0). The function goes through the points (1,1,) and (8,2), though you can't see the latter.
If we want to shift this function horizontally, we call that a horizontal shift.
Horizontal shift: shifting the function left or right by a value, c. Adding c shifts the function to the left, and subtracting c shifts the function to the right.
y=3x+c
Notice that we add/subtract our c value inside of the radicand, so we are directly adding or subtracting a value to the x value itself. Since the x value determines the function's position on the x-axis, it makes sense that by manipulating the x value, we are affecting the function's horizontal position.
Example: Shifting To the Right
Say we want to shift the parent function, y=3x, to the right by five units. We would subtract5 from the x value:
y=3x−5
We are subtracting 5 units from the x-value, which moves the function to the right on the x-axis. The graph of this cube root function looks like:
We can see that the parent function has been shifted to the right by 5 units because the new midpoint, or turning point, of the function is at (5,0). The midpoint of the parent function was at the origin, (0,0).
Now, let's look at the parent function shifted to the left!
Example: Shifting To the Left
Say we want to shift the parent function, y=3x, to the left by four units. We would add4 from the x value:
y=3x+4
We are adding 4 units to the x-value, which moves the function to the left on the x-axis. The graph of this cube root function looks like:
We can see that the parent function has been shifted to the left by 4 units because the new midpoint, or turning point, of the function is at (−4,0). The midpoint of the parent function was at the origin, (0,0).
Let's start with the basic radical graph, the parent function:
y=x
This graph can be seen above in purple, where it starts at the origin, (0,0) and curves up and to the right. Now, if we were to change the equation to:
y=x+5
The +5 means that we move the graph left by 5 units. Every point in the original graph moves left by 5. So, (0,0) becomes (5,0). We're very familiar with horizontal translations at this point.
Now, let's say that the equation is y=x−3. The graph would move to the right by 3 units. That's because of the −3 at the end.
Horizontal translations change how far left or right the graph is, but they don't change its shape.